
Rega HIV-1 Subtyping Tool Version 3.0 Tutorial
This version of Rega HIV-1 Subtyping Tool Version 3.0 allows the
assignment of subtypes (A-D, F-H, J, K), circular recombinant forms
(CRFs)
and unique recombinant forms (UFRs, i.e recombinants that are not
assigned
as CRFs). Version 3 has many new features, some of which are presented
in
this tutorial.
The input:
The Input section gives information on the method used for subtyping, the maximum numbers of sequences that can be submitted per job and formats that can be used for input. A user can either paste one of more sequence in FASTA format in the input field, upload a FASTA file or revisit results of a previous run (Figure 1).
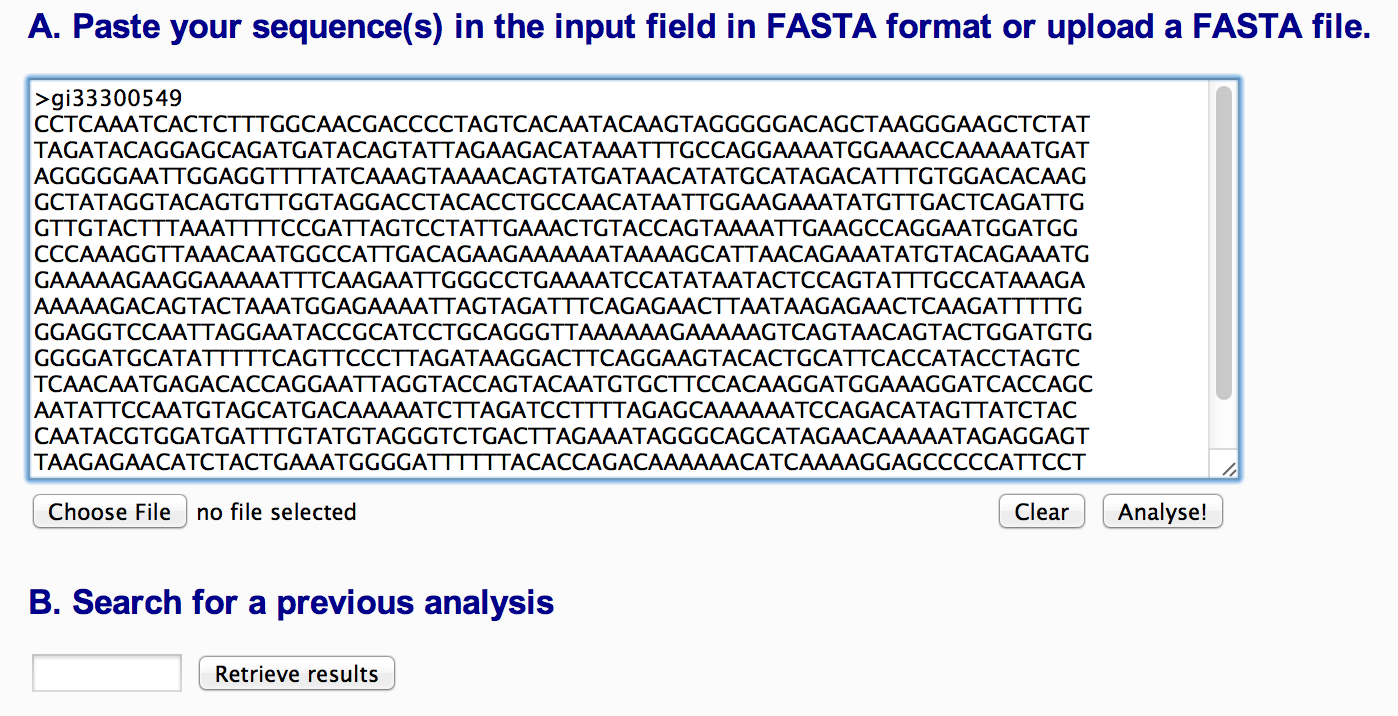 Figure 1: Input section of Rega HIV-1 Subtyping Tool V3
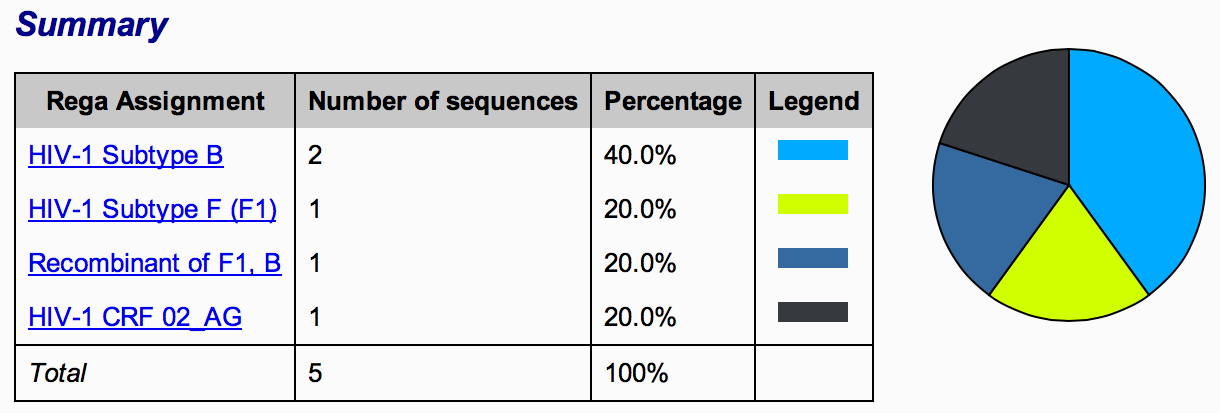 Figure 2: Summary table, Rega assignment
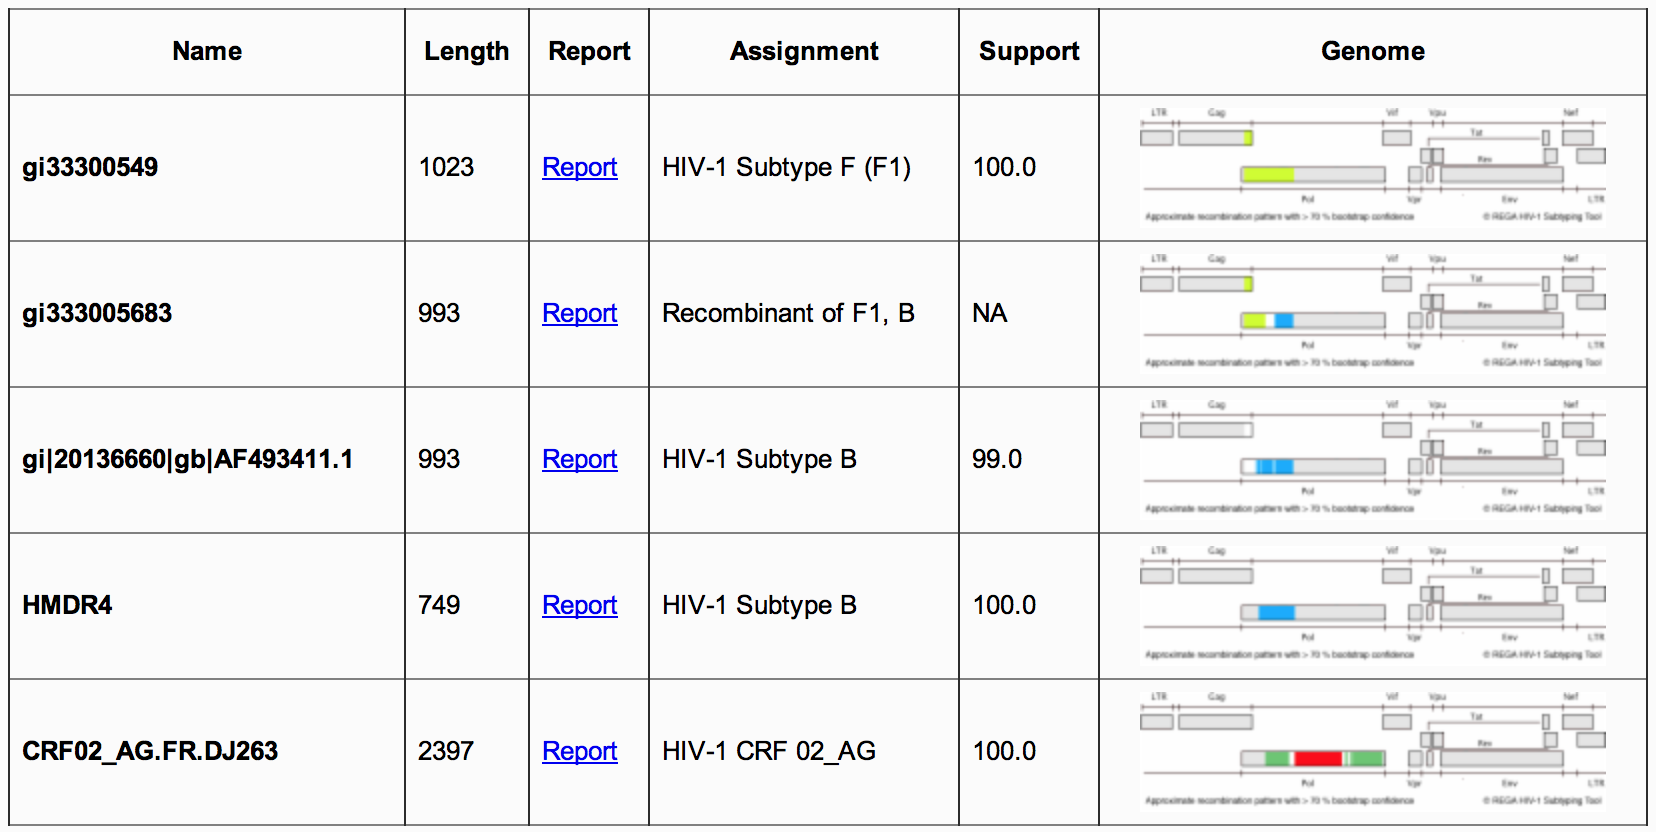 Figure 3: Summary report
 Figure 4: Download results
2) The
assignment report:
Figure 4: Download results
2) The
assignment report:
The assigned report is displayed when one of the Rega assignments is clicked. The assignment report contains three main sections:
2A) The summary table , contains information for each subtyped sequence, including its name, length, assigned subtype and a figure of the HIV-1 genome (Figure 5). Accessing the report link will take the user to the genotyping details report.
2B) The download results links allows the user to download the batch results in a number of formats (CSV, XML, Excell) (Figure 5). It also allows users the opportunity to download all sequences for a given assignment, in Fasta format.
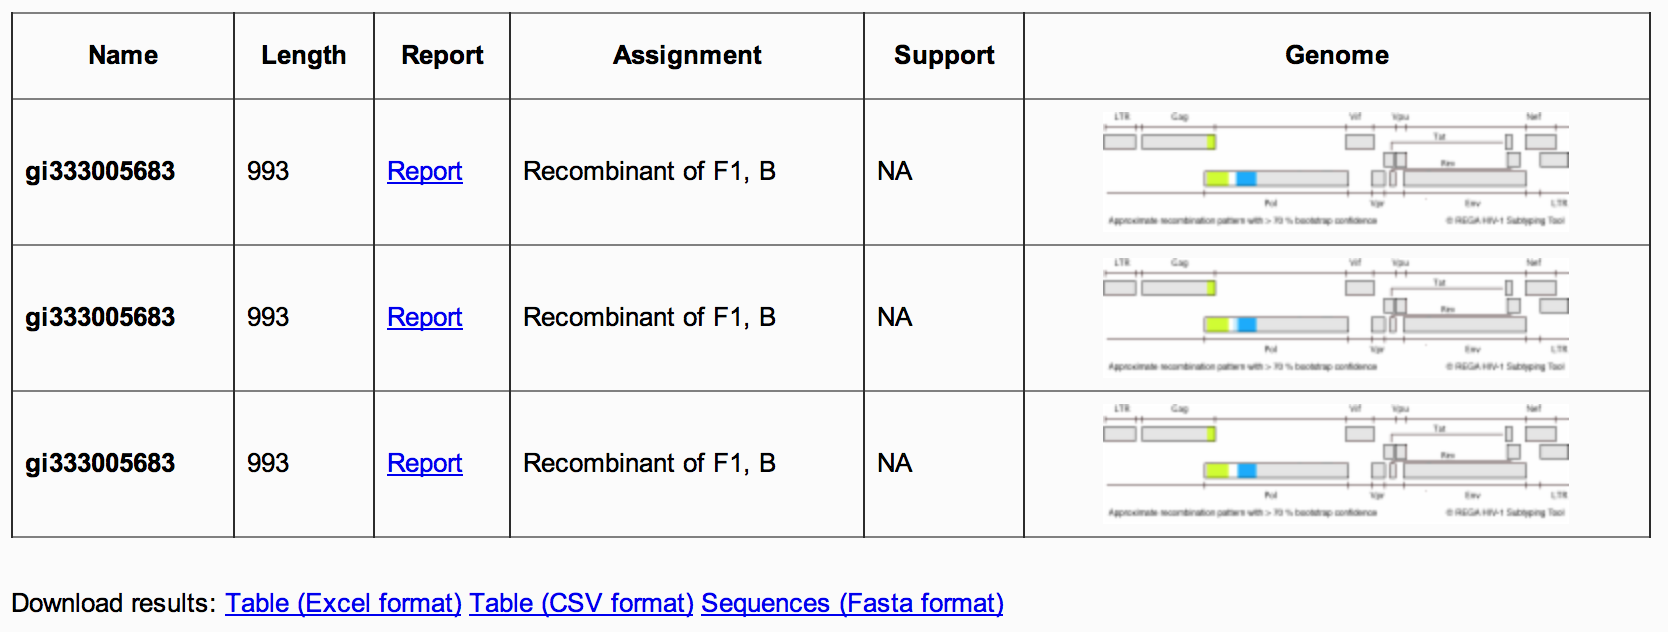 Figure 5: Assignment report summary table
2C) The Phylogenetic statistics section
contains one to two graphics (Figure 6). The first graphic shows the
neighbor-joining tree statistics for the pure subtype reference
assignment, including the average bootstrap support of the query
sequence
and the reference dataset. In addition, the inside and outside bootstrap
results are displayed. These results are useful for the
identification of
the relationship of the query sequence and the reference dataset in a
phylogenetic tree. The second graphic (available only for
recombinants)
displays the bootscanning support statistics, including the average
bootscan, average bootscan support (i.e > 70 bootstrap) and average
bootscan without support (< 70 bootstrap).
Figure 5: Assignment report summary table
2C) The Phylogenetic statistics section
contains one to two graphics (Figure 6). The first graphic shows the
neighbor-joining tree statistics for the pure subtype reference
assignment, including the average bootstrap support of the query
sequence
and the reference dataset. In addition, the inside and outside bootstrap
results are displayed. These results are useful for the
identification of
the relationship of the query sequence and the reference dataset in a
phylogenetic tree. The second graphic (available only for
recombinants)
displays the bootscanning support statistics, including the average
bootscan, average bootscan support (i.e > 70 bootstrap) and average
bootscan without support (< 70 bootstrap).
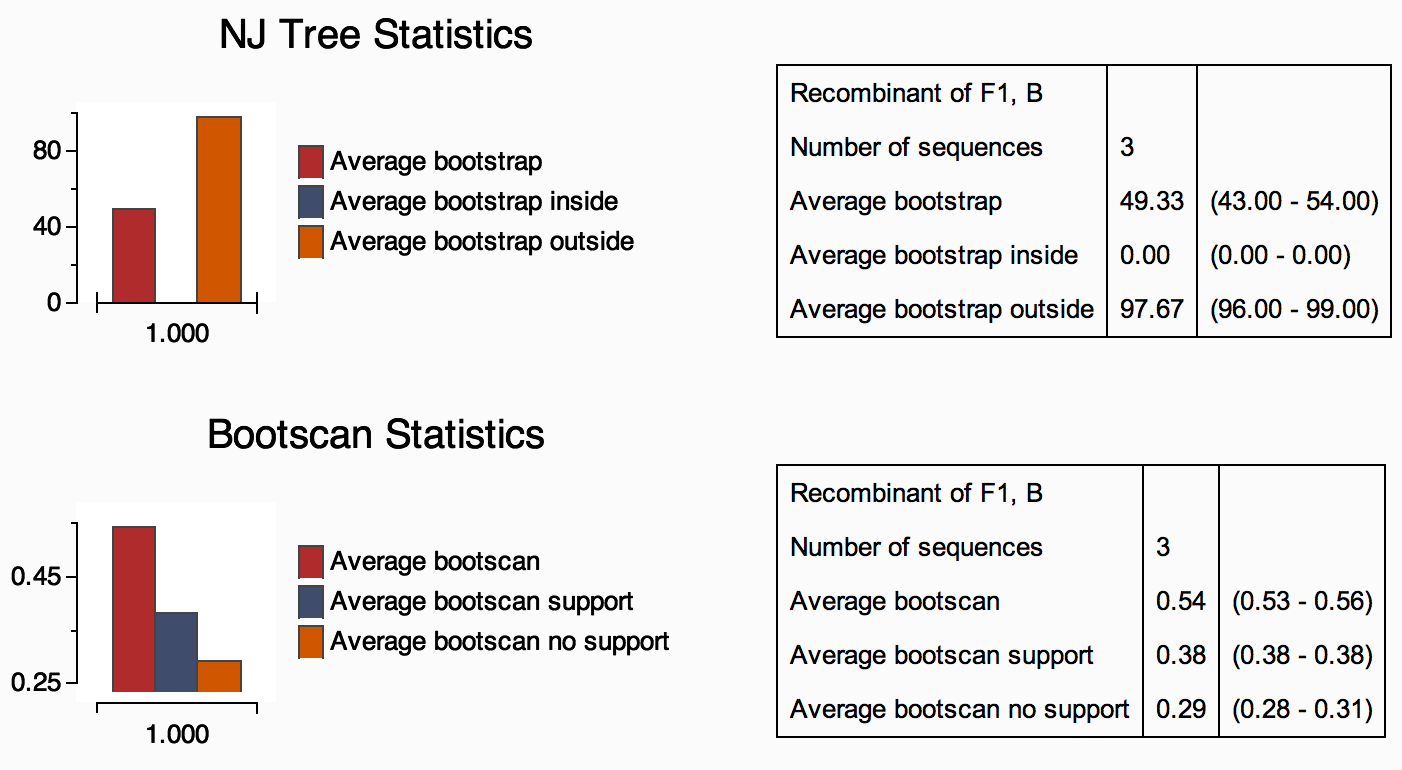 Figure 6:Assignment report phylogenetic statistics
3) Genotyping details report
Figure 6:Assignment report phylogenetic statistics
3) Genotyping details report
The genotyping details report is composed of three sections named:
3A) The sequence assignment section (Figure 7) contains information on:
- The sequence submitted (name and length),
- The classification assignment (subtype, subgroup and bootstrap support),
- A graphical representation of the HIV-1 genome showing the genomic region of the - Query sequence with the start and end positions related to the HXB2 genome,
- The motivation of the classification (this is based on the decision tree).
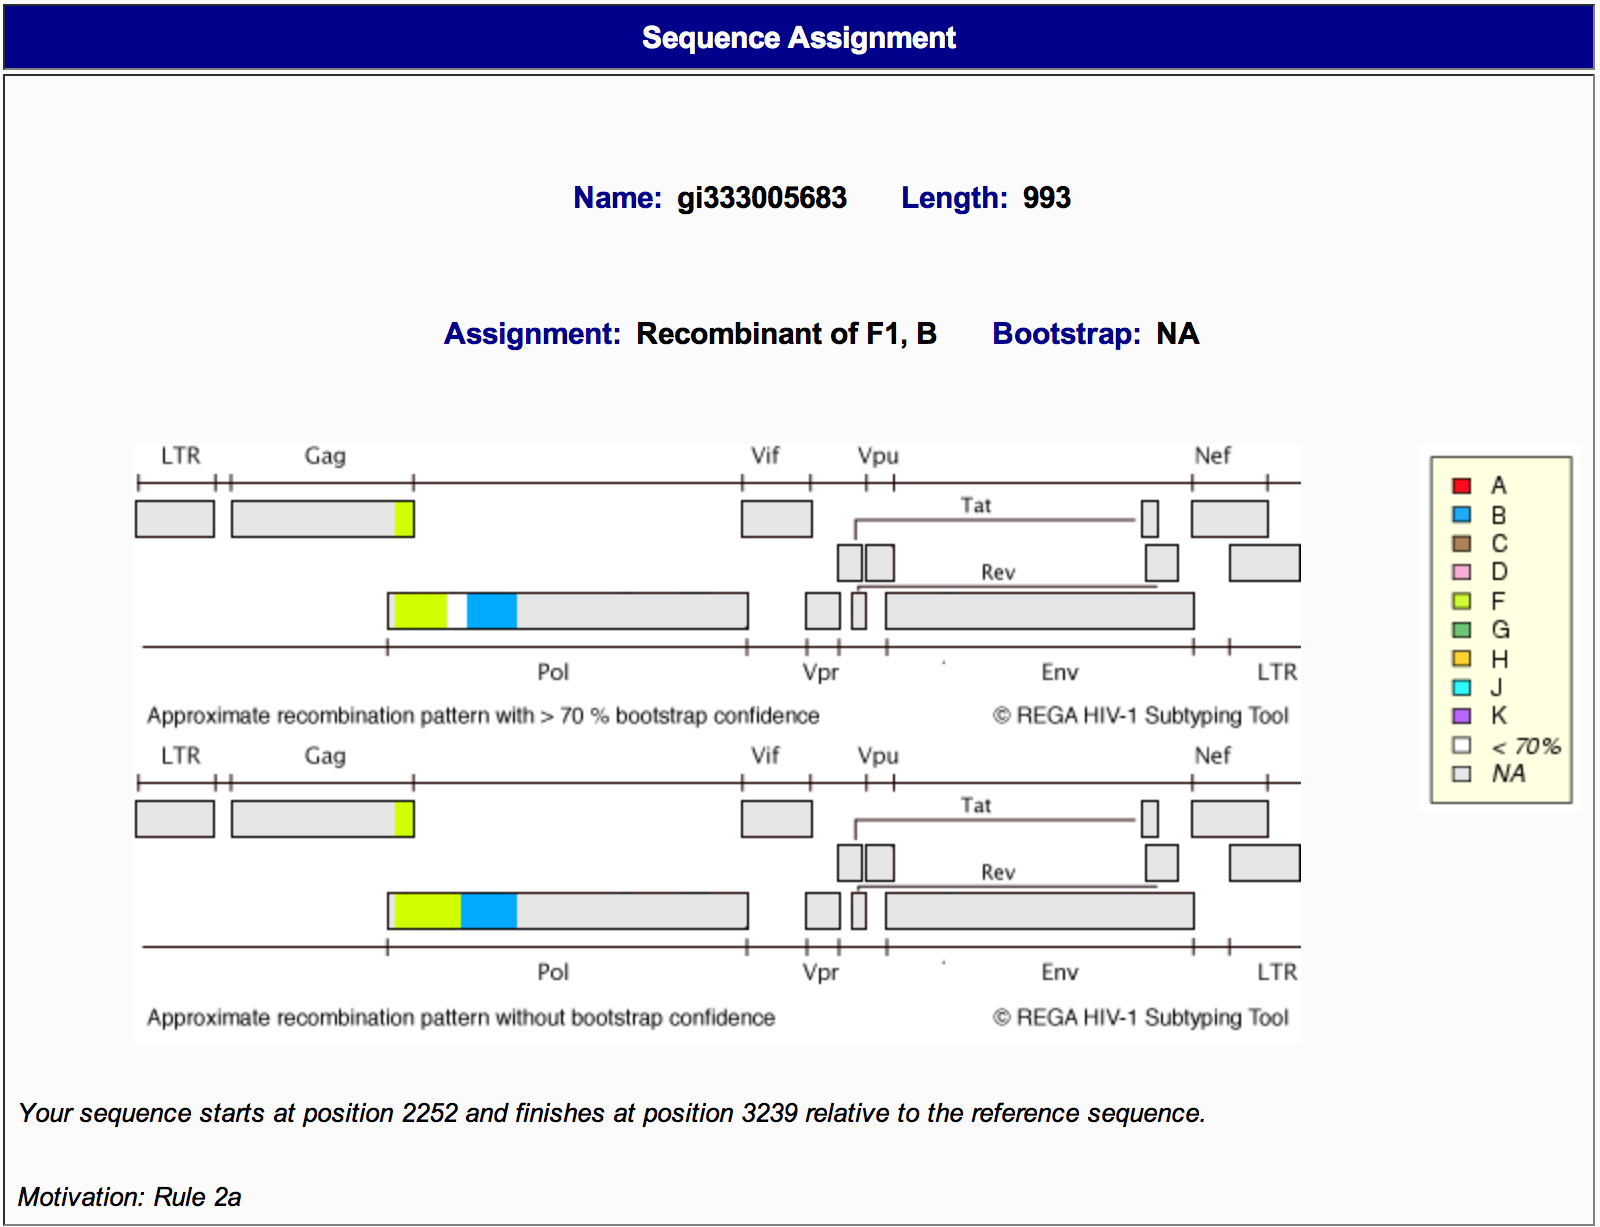 Figure 7: Genotyping details report sequence assignment
3B) The analysis details section (Figure 8) is divided in two parts, named: phylogenetic analysis with pure subtypes and phylogenetic analysis with pure subtypes and CRFs. It displays:
- Bootstrap supports, including inside and outside supports,
- Access to download the alignment in Nexus and Fasta format,
- The phylogenetic tree in PDF and Nexus format,
- The log file generated by PAUP (which contains information on the model of evolution and its parameters and bootstrap support).
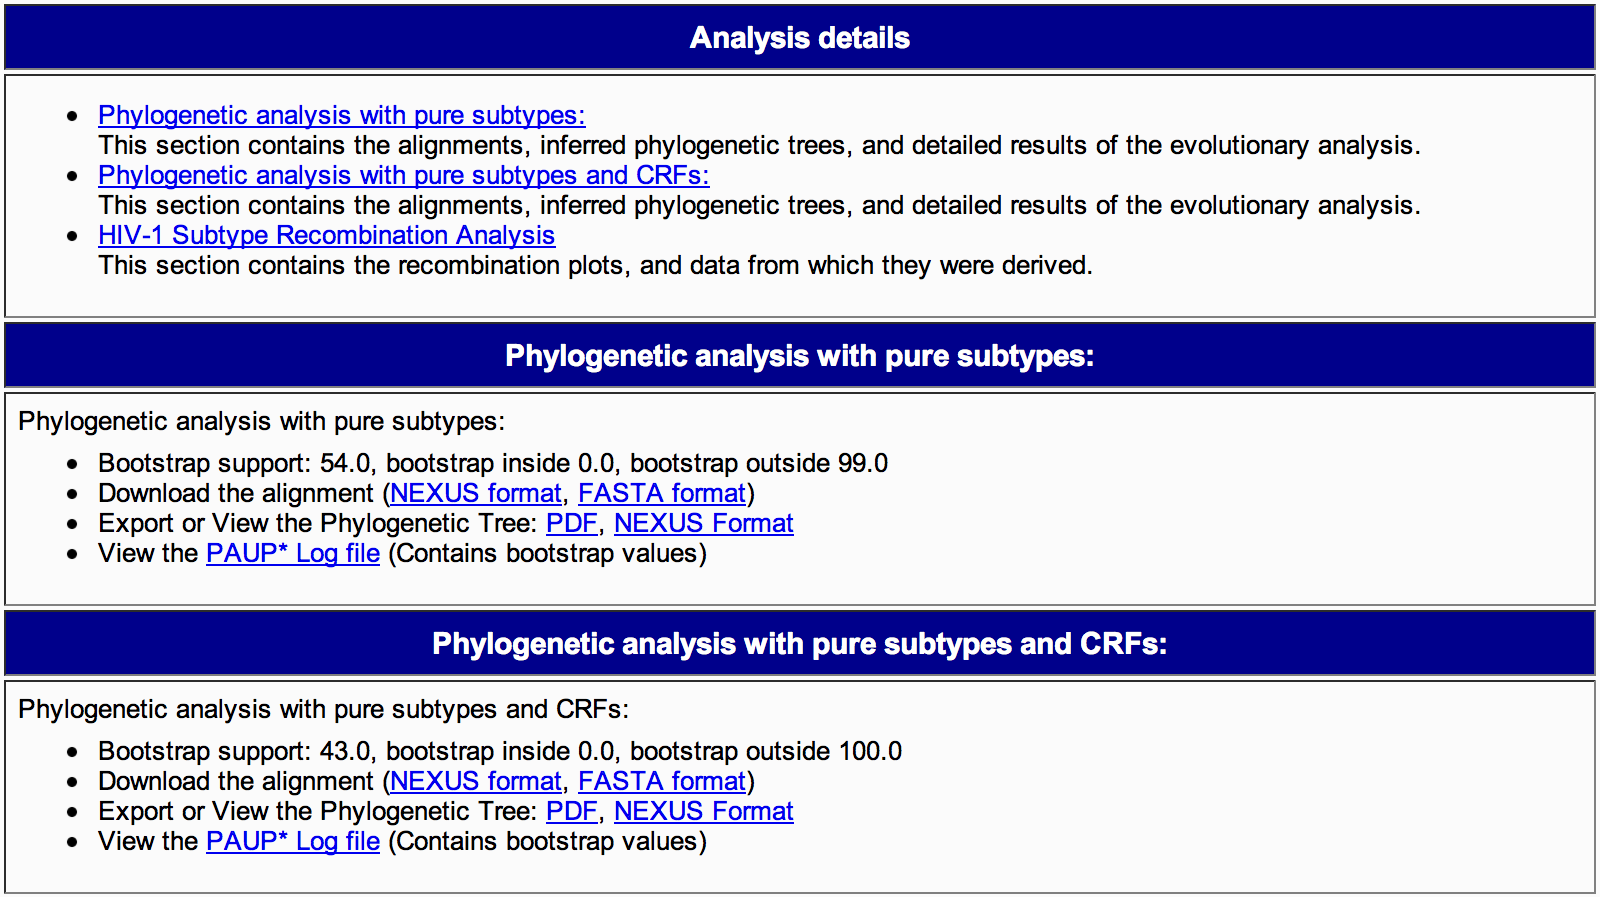 Figure 8: Genotyping details report phylogenetic analysis
3C) The HIV-1 subtype recombination analysis section
(Figure 9). This section contains information on:
Figure 8: Genotyping details report phylogenetic analysis
3C) The HIV-1 subtype recombination analysis section
(Figure 9). This section contains information on:
- Graphical image of the bootscanning results,
- Bootscan cluster support,
- Access to download the image and its results in CSV and PDF format,
- The size of the window and step size of the alignment,
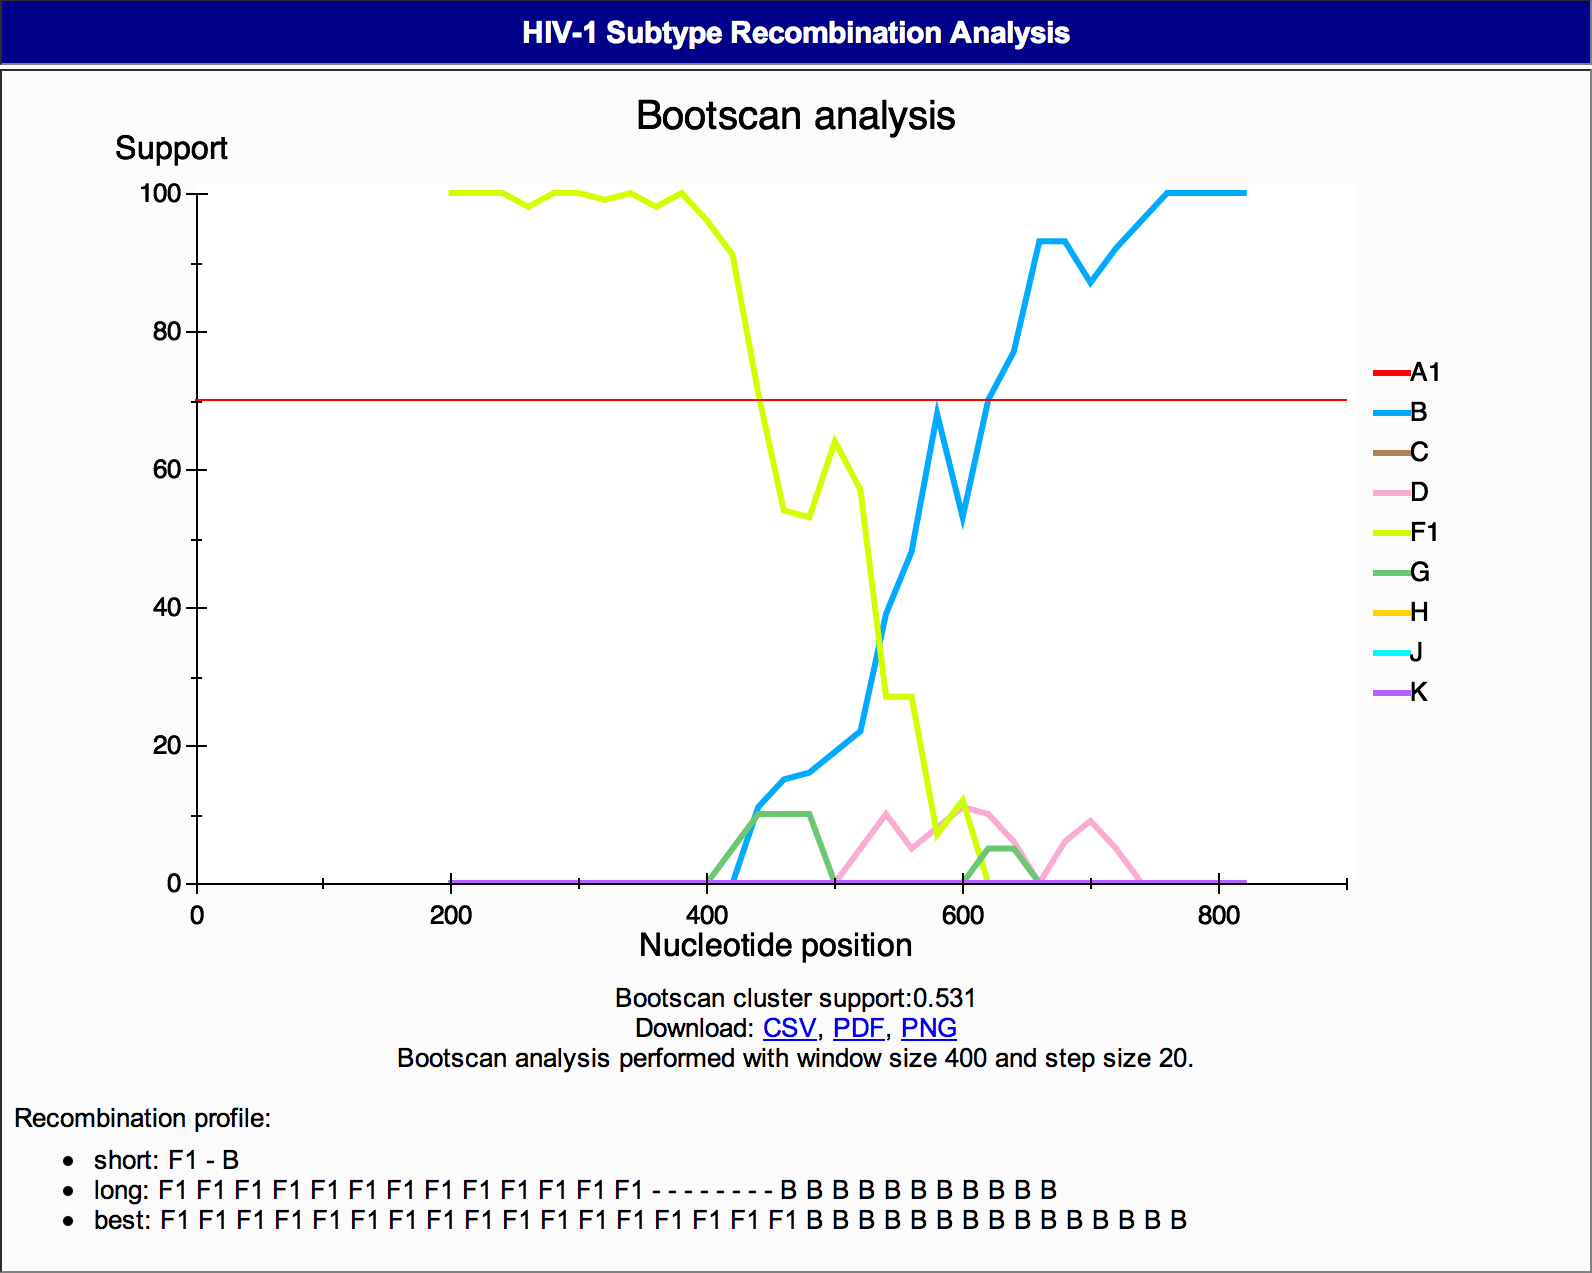 Figure 9: Genotyping details HIV-1 Subtype Recombination Analysis
The input:
The Input section gives information on the method used for subtyping, the maximum numbers of sequences that can be submitted per job and formats that can be used for input. A user can either paste one of more sequence in FASTA format in the input field, upload a FASTA file or revisit results of a previous run (Figure 1).
Figure 1: Input section of Rega HIV-1 Subtyping Tool V3
The output:
The Output of Rega HIV-1 Subtyping Tool V3 contains detailed results of subtyping and recombination analyses. These results are displayed in a number of reports:
The summary report is displayed during the analysis process and it is updated every 5 seconds. The summary report contains three main sections:
1A) The Summary table , The first section presents a table that provides information on the Rega assignment, number and percentage of sequences assigned. The assignments are also represented in a pie chart graphic (Figure 2). Accessing the assignment link will take the user to the assignment report of each assigned results (e.g. HIV-1 subtypes, CRFs and recombinants).
The Output of Rega HIV-1 Subtyping Tool V3 contains detailed results of subtyping and recombination analyses. These results are displayed in a number of reports:
- 1) The Summary report,
- 2) Assignment reports,
- 3) The Genotyping details report
The summary report is displayed during the analysis process and it is updated every 5 seconds. The summary report contains three main sections:
- 1A) The summary table,
- 1B) The query sequence summary information,
- 1C) The download results links (which is available only when the analysis is finished)
1A) The Summary table , The first section presents a table that provides information on the Rega assignment, number and percentage of sequences assigned. The assignments are also represented in a pie chart graphic (Figure 2). Accessing the assignment link will take the user to the assignment report of each assigned results (e.g. HIV-1 subtypes, CRFs and recombinants).
Figure 2: Summary table, Rega assignment
1B) The
second section of the summary report (Figure 3)
, is presented
in a table that contains information on each query sequence, including
its name, length, assigned subtype and HVI-1 genome image, which is
color coded by subtype. Accessing the report link will take the user
to
the genotyping details report.
Figure 3: Summary report
1C) The download results
links
only appears when the analyses (i.e. job) end. It allows
users to download the batch results in a number of formats. Results are
provided in XML, CSV and Excell table format (Figure 4). These
available
formats are useful for the analyses of large datasets and databases that
use the Rega HIV-1 Subtyping Tool.
Figure 4: Download results
The assigned report is displayed when one of the Rega assignments is clicked. The assignment report contains three main sections:
- 2A) The assignment summary table,
- 2B) The download results links and,
- 2C) The phylogenetic statistics.
2A) The summary table , contains information for each subtyped sequence, including its name, length, assigned subtype and a figure of the HIV-1 genome (Figure 5). Accessing the report link will take the user to the genotyping details report.
2B) The download results links allows the user to download the batch results in a number of formats (CSV, XML, Excell) (Figure 5). It also allows users the opportunity to download all sequences for a given assignment, in Fasta format.
Figure 5: Assignment report summary table
Figure 6:Assignment report phylogenetic statistics
The genotyping details report is composed of three sections named:
- 3A) The sequence assignment,
- 3B) The analysis details (Phylogenetic analysis with pure subtypes, Phylogenetic analysis with pure subtypes and CRFs, HIV-1 Subtype Recombination Analysis) and,
- 3C) The phylogenetic analyses.
3A) The sequence assignment section (Figure 7) contains information on:
- The sequence submitted (name and length),
- The classification assignment (subtype, subgroup and bootstrap support),
- A graphical representation of the HIV-1 genome showing the genomic region of the - Query sequence with the start and end positions related to the HXB2 genome,
- The motivation of the classification (this is based on the decision tree).
Figure 7: Genotyping details report sequence assignment
3B) The analysis details section (Figure 8) is divided in two parts, named: phylogenetic analysis with pure subtypes and phylogenetic analysis with pure subtypes and CRFs. It displays:
- Bootstrap supports, including inside and outside supports,
- Access to download the alignment in Nexus and Fasta format,
- The phylogenetic tree in PDF and Nexus format,
- The log file generated by PAUP (which contains information on the model of evolution and its parameters and bootstrap support).
Figure 8: Genotyping details report phylogenetic analysis
- Graphical image of the bootscanning results,
- Bootscan cluster support,
- Access to download the image and its results in CSV and PDF format,
- The size of the window and step size of the alignment,
Figure 9: Genotyping details HIV-1 Subtype Recombination Analysis